The electrostatically driven adsorption of polymer and nano-particle multilayers is a well-established method for the physical and chemical transformation of surfaces to produce highly tailored and often “smart”, environmentally sensitive interfaces. The deposition process can be sensitively monitored using QCM-I, which provides information on the hydrated mass of the multilayer as well as its physical structure and rigidity1. Differences in the deposition parameters can dramatically impact the multilayer structure and its ultimate performance.
Experimental Introduction
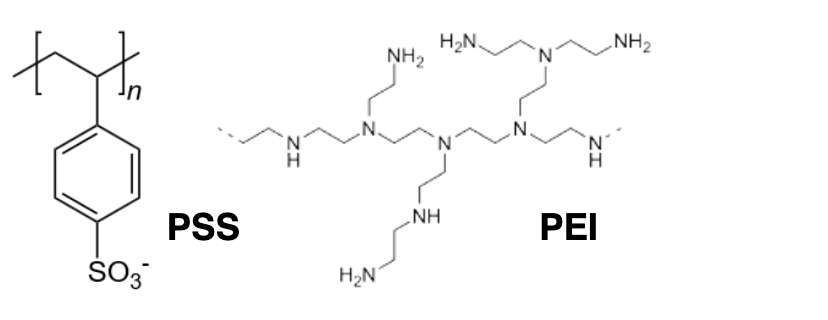
This application note describes the data obtained from the adsorption of a polyethylenimine (PEI) and polystyrene sulfonate (PSS) multilayer onto a MicroVacuum ITO coated QCM-I sensor crystal. The QCM-I instrument monitors the impedance spectrum of an oscillating quartz crystal sensor, tracking the changes in the resonant frequencies (F) of its fundamental and overtones as well as their peak widths (Full Width Half Maximum, w, all in Hz). The former is a function of the mass coupled to the sensor surface and the latter, of the viscoelasticity or rigidity of the coupled material
The experiment was performed with a continuous flow of HEPES buffer, pH7.4, over the sensor surface. Alternate aliquots of PEI and PSS were flowed over the senor surface for 10 minutes with 10 minutes of rinse in between.
Results
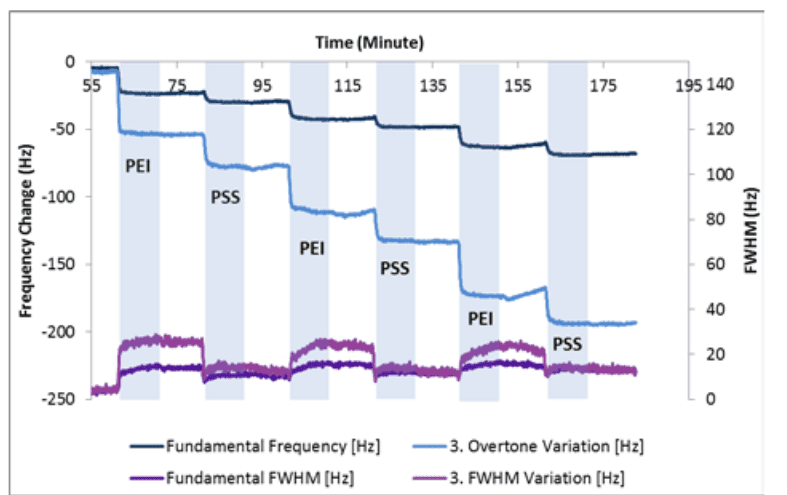
Figure 1 shows the changes in the fundamental (F1, w1) and 3rd harmonic (F3, w3) as successive layers of PEI and PSS are adsorbed to the ITO surface.
The frequency change (∆f) can be converted to a mass change (∆m) using the Sauerbrey equation, which assumes a rigidly coupled polymer layer. For the quartz crystal sensor used here this reduces to:∆mn = -∆fn x 17.7 / n ngcm-2/Hz, where n is the overtone number. This is shown for the fundamental and 3rd harmonic in Figure 2.
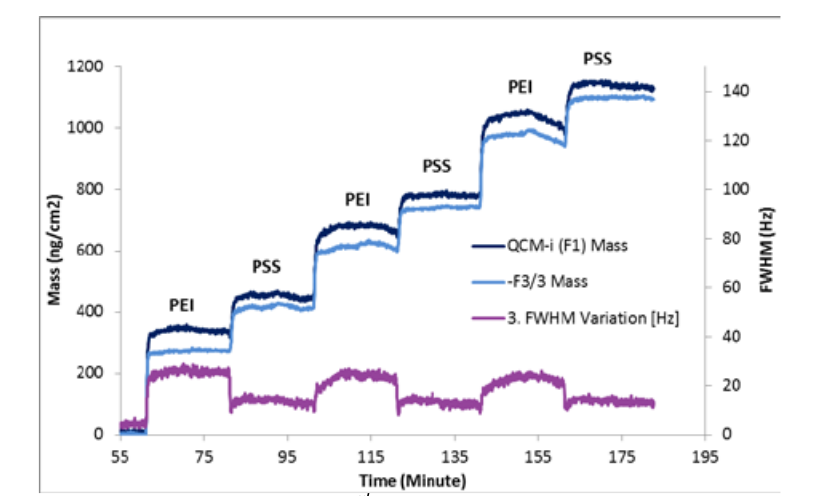
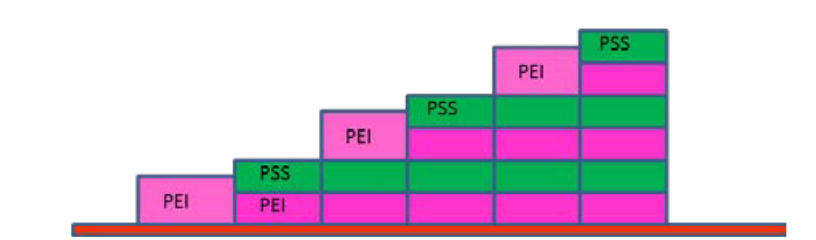
The mass corresponds to the mass of the polymer, ions and water coupled to the sensor surface. The initial PEI layer is not rigidly coupled, so the F1 and F3 mass values are slightly different and the peak width w increases. (F1 moves ~3x as far as F3, so is much less affected by loss of rigidity). As the PSS is added the difference between the two masses as well as w reduces showing the layer becomes more rigid. The mass change for PSS is smaller than for PEI which is not expected on the basis of the polymer structure per unit of charge, so it is likely that the PSS causes the PEI layer to collapse. This process is repeated as the alternate layers are added. However as w does not progressively increase it is clear that the multilayer builds as rigid sublayers with a more diffuse top layer, as shown below.
Determining the masses of the polymer layers, excluding the effects of hydration requires use of a complementary technique such as OWLS2.
References:
1 Heuberger R, Sukhorukov G, Voros J, Textor M, Mohwald H, “Biofunctional polyelectrolyte multilayers and microcapsules: control of non-specific and biospecific protein adsorption” Advanced Functional Materials, 15 (3): 357-366, 2005
2 OWLS application Note No 0016Experiments performed by Dr M Swann in the lab of Prof. J.Lu, University of Manchester, UK