Understanding the adsorption of surface active layers is complex. The most useful real-time techniques provide multiple pieces of information, however a much clearer picture can be obtained by combining such techniques.1 QCM-I measures changes relating to the hydrated mass and rigidity of surface layers. Combining this with an optical technique such as OWLS, the “dry mass” of the polymer and associated ions can be distinguished from the hydrated mass. This enables a greater insight into the processes taking place, with significantly less ambiguity.
Experimental Introduction
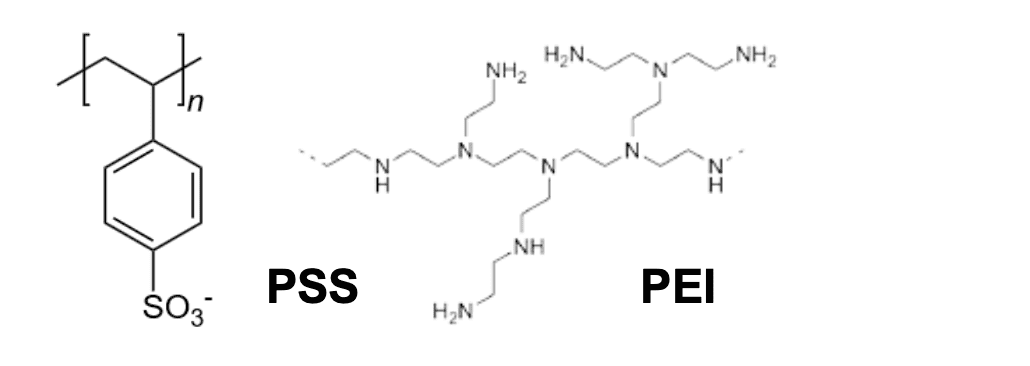
This application note describes the data obtained from the adsorption of a polyethylenimine (PEI) and polystyrene sulfonate (PSS) multilayer onto a MicroVacuum ITO coated QCM-I sensor crystal and an ITO coated OWLS chip.
The experiments were performed with a continuous flow of HEPES buffer, pH7.4, over the sensor surface. Alternate aliquots of PEI and PSS were flowed over the senor surface for 10 minutes with 10 minutes of rinse in between.
The QCM-I instrument monitors the impedance spectrum of an oscillating quartz crystal sensor, tracking the changes in the resonant frequencies of its fundamental and overtones ( up to the 13th for a 5MHz crystal ). as well as their peak widths (FWHM, all in Hz). The former is a function of the mass coupled to the sensor surface and the latter, of the viscoelasticity or rigidity of the coupled material.
The OWLS instrument monitors the TE and TM waveguide modes of a waveguide sensor chip, which allows the thickness and RI of an overlayer to be calculated. This can be converted to a “dry” mass using the de Feijter equation1 and applying a standard dn/dc value for the material concerned.
Results
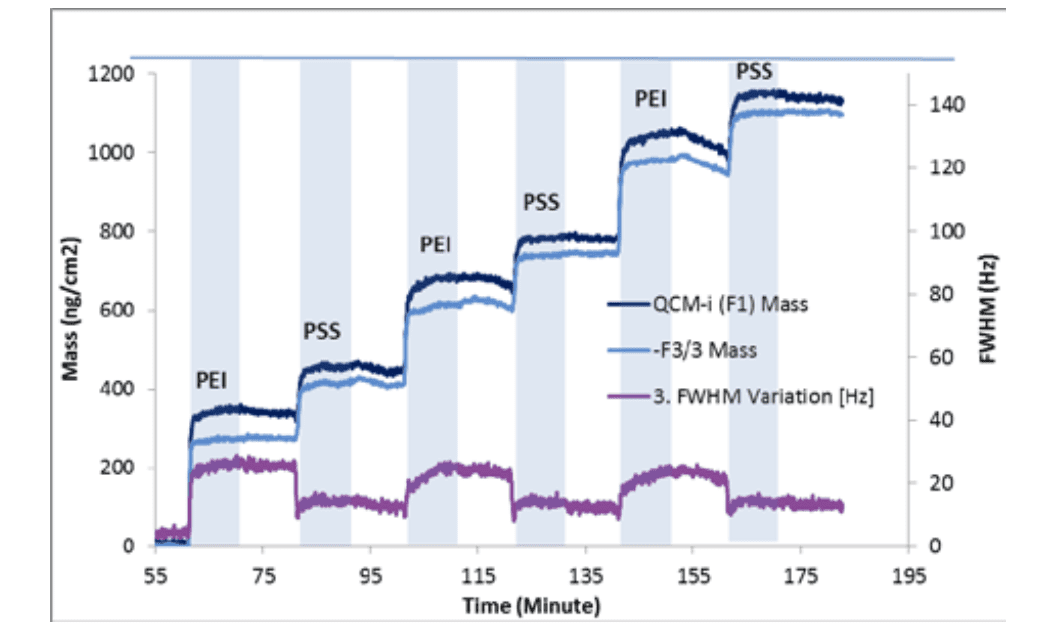
Figure 1 shows the calculated changes in Mass and peak width obtained with the QCM-I instrument as layers of PEI and PSS are adsorbed to the ITO surface2. This allowed the approximate schematic model in figure 2 to be created.
However because of the hydrated extent of the PEI, it is difficult to say how much of the mass added with each PEI layer is polymer and ions or how much is water. Similarly whether a small amount of PSS simply rigidifies the hydrated PEI layer, or indeed whether it displaces some of the PEI.
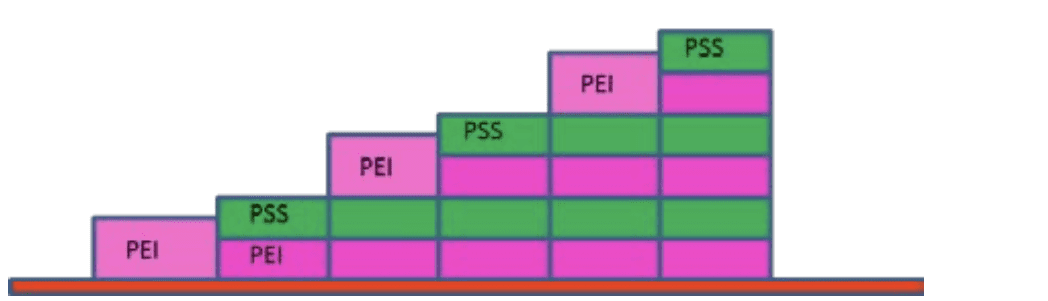
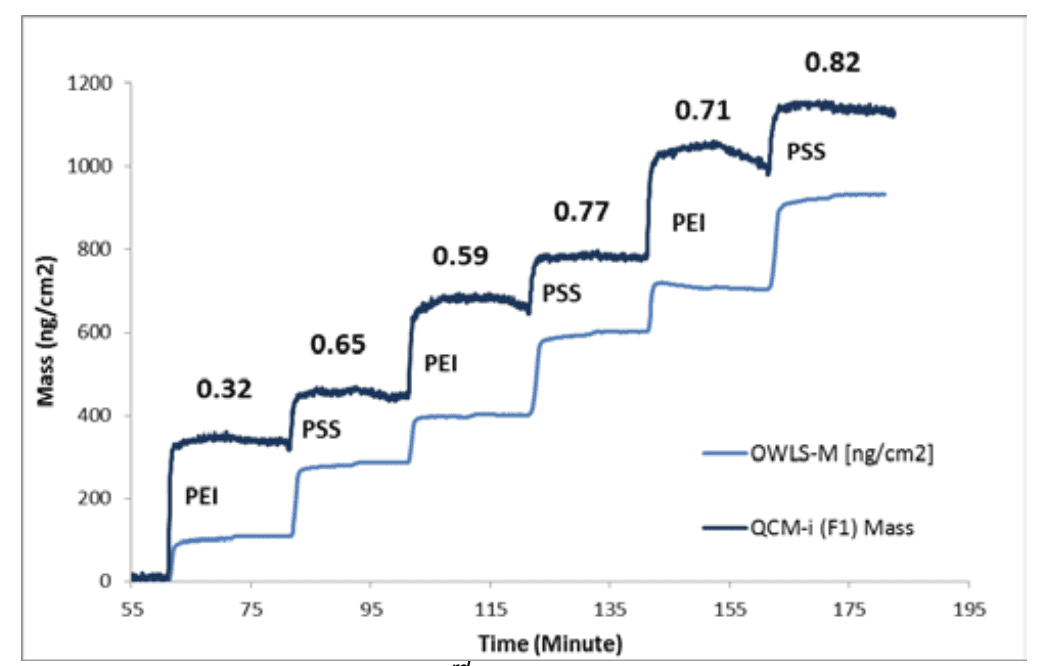
Figure 3 shows the QCM-I mass together with the mass calculated from the OWLS experiment. Combining the two techniques now allows a polymer volume fraction to be calculated which is shown numerically for each layer. The PSS can be seen, in fact, to add more polymer mass than the PEI and significantly reduce the hydration of the underlying PEI layer, as the volume fraction increases and the mass difference remains the same as each double layer is added. This allows a significantly clearer understanding of the deposition process to be obtained.
Note: During the frequency change measurements all six harmonics, up to 65 MHz were recorded, but for simplicity the fundamental and the 3rd. harmonics are reported here only.
Reference: 1 Using Complementary Acoustic and Optical Techniques for Quantitative Monitoring of Biomolecular Adsorption at Interfaces, R.Konradi, M.Textor and E.Reimhult, Biosensors 2012, 2, 341-376 2 QCM-I application Note No 0015. Experiments performed by Dr M Swann in the lab of Prof. J.Lu, University of Manchester.